What is a Vision Zero Map?
A Vision Zero map is an interactive traffic fatality map that displays car accidents, pedestrian deaths, and crash data on a geographic interface. These maps are essential tools for understanding where traffic deaths occur, identifying dangerous intersections, and advocating for safer street design.
Traditionally, Vision Zero maps have been created by individual cities and counties with the resources to commission custom mapping projects. New York City has a Vision Zero map. San Francisco has one. Chicago developed their own traffic death map. But what about everywhere else?
The Problem: Most communities in America don't have access to a local Vision Zero map. Rural areas, small cities, and under-resourced counties are left without the data visualization tools necessary to understand and address their traffic safety challenges.
A National Traffic Fatality Map for Everyone
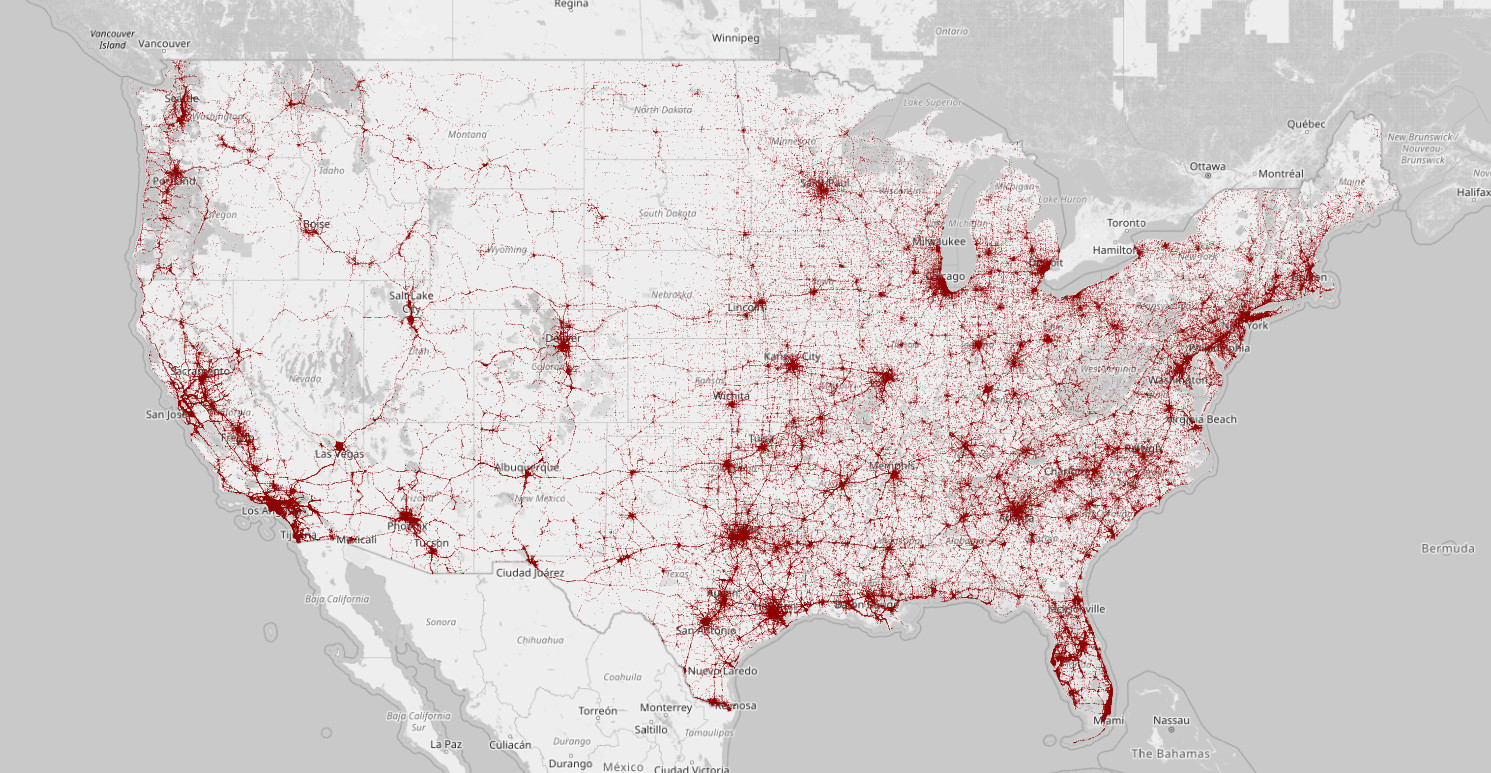
Roadway Report solves this problem by providing a comprehensive car accident map that covers all 50 states. Our traffic death map includes every fatal crash reported in the United States, making it the most complete Vision Zero map available anywhere.
Why Choose Roadway Report's Vision Zero Map?
Local City Maps
- Limited to city boundaries
- Often 2-5 years of data
- May cost taxpayers millions
- Infrequent updates
- Only in well-funded cities
Roadway Report Map
- Covers entire United States
- 20+ years of historical data
- Completely free to use
- Regular data updates
- Works in rural & urban areas
Our Car Death Map Works Everywhere
Whether you're researching traffic safety in a major metropolitan area or advocating for better roads in a rural county, Roadway Report's traffic fatality map provides the data you need. Our car accident map includes:
- Every fatal traffic crash reported in the United States
- Detailed location data for each fatality
- Historical trends spanning more than a decade
- Pedestrian, cyclist, and vehicle occupant deaths
- Crash circumstances and contributing factors
- Interactive filtering and search capabilities
- Export tools for researchers and journalists
Vision Zero Maps for Cities Without Resources
The communities that need traffic safety data the most are often the ones least able to afford custom mapping solutions. Rural counties, small towns, and under-resourced urban areas face significant traffic safety challenges but lack the budget to develop their own Vision Zero map.
Roadway Report democratizes access to traffic death data. Our car death map works just as well for a town of 5,000 people as it does for a city of 5 million. No community should be left without the tools to understand and address their traffic fatality problem.
Your Community Has Data
Search our traffic fatality map for data in your area:
Who Uses Our Traffic Death Map?
Traffic Safety Advocates
Use our car accident map to identify dangerous intersections, build cases for street redesigns, and hold officials accountable for Vision Zero commitments.
Journalists & Researchers
Access comprehensive traffic fatality data for investigative reporting, academic research, and data-driven journalism about road safety.
City Planners & Engineers
Analyze crash patterns, evaluate infrastructure improvements, and prioritize safety investments using our Vision Zero map data.
Community Organizations
Educate residents about local traffic safety issues and organize grassroots campaigns for safer streets using data from our car death map.
Faster, More Comprehensive Than Local Maps
Even in cities that have invested in their own Vision Zero maps, Roadway Report often provides superior functionality. Our traffic fatality map typically includes:
- More years of historical data than most local maps
- Faster load times and more responsive interface
- Cross-jurisdictional data (see patterns across city/county lines)
- Consistent data methodology across all locations
- Advanced filtering and export capabilities
Beyond the Map: Understanding Traffic Deaths
A Vision Zero map is only valuable if people use it to drive change. Our car accident map is designed to be accessible to everyone—not just data scientists and traffic engineers. Whether you're a concerned parent, a local activist, or a city council member, you can use our traffic death map to:
- Identify the most dangerous roads in your community
- Track whether safety interventions are working
- Compare your area's traffic fatality rate to others
- Understand patterns in pedestrian and cyclist deaths
- Build evidence-based cases for infrastructure changes
Free, Open, and Always Available
Roadway Report's Vision Zero map is free to use and will always remain free. We believe traffic safety data should be a public good, accessible to everyone regardless of budget or technical expertise.
Our car death map represents thousands of hours of data processing, cleaning, and visualization work—but we provide it at no cost because we believe every community deserves the tools to make their streets safer.
For Developers & Researchers: Need programmatic access to our traffic fatality data? We offer a free API with 100 requests per day. Paid plans with unlimited access are available for larger projects.
Start Exploring Traffic Data Today
Whether you're searching for a "vision zero map near me," trying to understand traffic patterns in your rural county, or conducting research on pedestrian safety nationwide, Roadway Report's traffic fatality map provides the comprehensive data you need.
Our car accident map is updated regularly with the latest available data from official sources. We're committed to maintaining the most accurate and complete traffic death map available to the public.
Access the National Vision Zero Map
Explore traffic fatality data for any location in the United States. Free, fast, and comprehensive.
Launch Interactive MapMaking Vision Zero Real
A Vision Zero map alone won't eliminate traffic deaths. But it's an essential tool for understanding the problem, tracking progress, and holding decision-makers accountable. By providing free access to comprehensive traffic death data, Roadway Report empowers communities everywhere to work toward the goal of zero traffic fatalities.
Every dot on our car death map represents a life lost, a family devastated, a preventable tragedy. Our traffic fatality map exists to honor those lives by providing the transparency and data access necessary to prevent future deaths.
Whether your community has a formal Vision Zero policy or not, the data matters. Start exploring our traffic death map today and join the movement for safer streets in America.